Specialist E-commerce Brand
UK specialist manufacturer and online retailer · Google Ads (Shopping, Performance Max, Search)
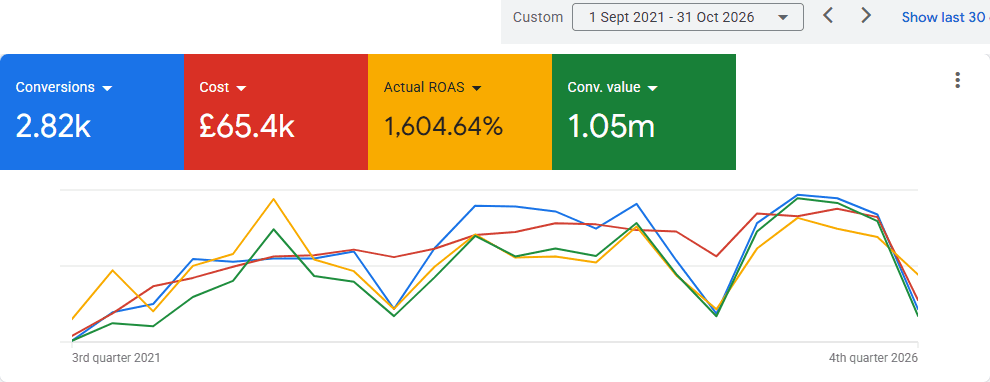
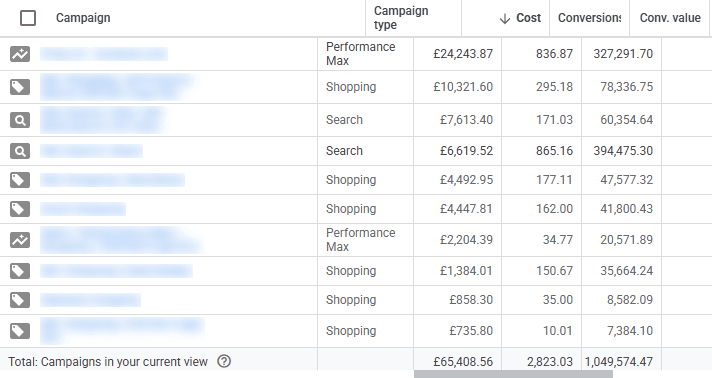
We built this Google Ads account from launch and ran it for five years. £65.4k of ad spend brought in £1.05m of tracked revenue, a 16x return. In the last 12 months spend was 2.4x the first year's and cost per order stayed at £22.
By the numbers
Where we started
The client designs and makes its own products in the UK and sells them online. Most of the range comes in lots of made-to-fit versions, so the catalogue runs to well over a thousand products and most of them only sell a handful of times a year. Orders are big, but there aren't many of them.
We set the account up from scratch in September 2021, so there's no earlier agency to compare against. The job was to grow spend year on year without the cost of each order creeping up, on an account that only gets 30 to 80 orders a month. At that volume a quiet fortnight looks like a crisis if you only look at two months at a time, so part of the job was knowing when not to change anything.
The approach
Built the account from launch
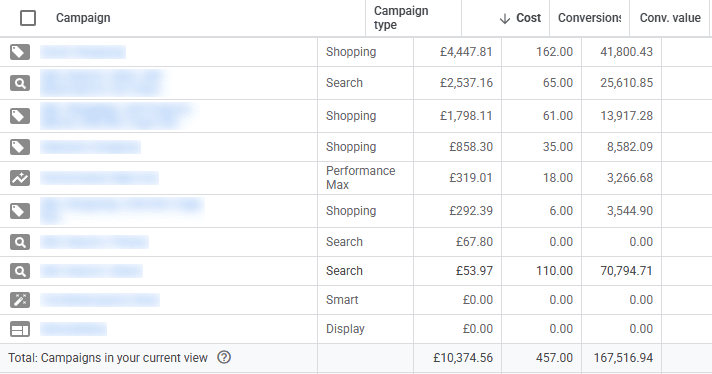
We started in September 2021 with Dynamic Search Ads and a standard Shopping campaign covering the whole catalogue, then moved the Shopping spend to Smart Shopping in 2022.
Split Shopping by product line
In 2023 we broke Shopping into separate campaigns for each main product line, each with its own budget, plus a holding campaign for products that took clicks without selling. One of those product-line campaigns went on to return 32x in 2024.
Moved to Performance Max with brand searches kept apart
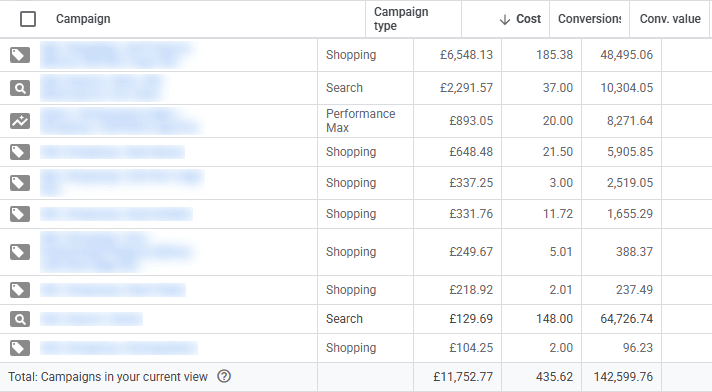
From 2024 the product spend ran through Performance Max. People searching for the brand by name went to a separate, cheap exact-match Search campaign, so the product campaigns weren't paying for customers who were already looking for the client.
Read the full monthly series before changing anything
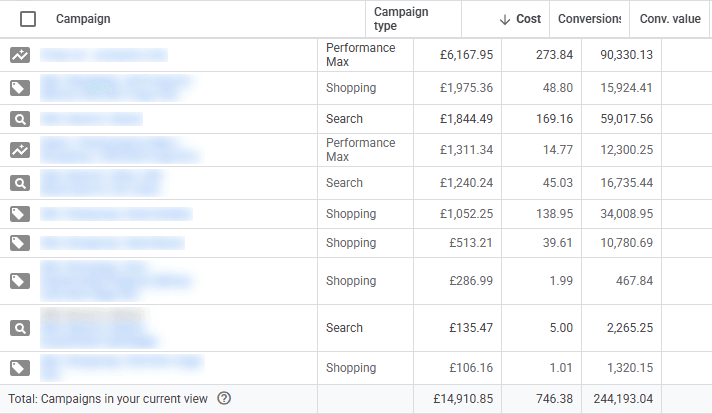
With so few orders a month, comparing one month with the next makes up trends that aren't there. We judge it against its full monthly history, so a quiet month gets compared with the account's normal range before anything changes.
Restructured around product types this year
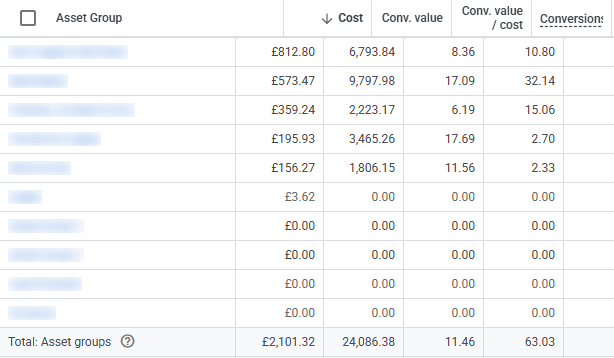
This year we split Performance Max into separate asset groups for each product type, each with its own images, headlines and landing pages, and moved the purchase tracking to data-driven attribution so it counts every order.
What happened
- Five years in total: £65,409 of ad spend, 2,823 orders and £1,049,574 of tracked revenue. That's a 16.0x return and £23.17 per order.
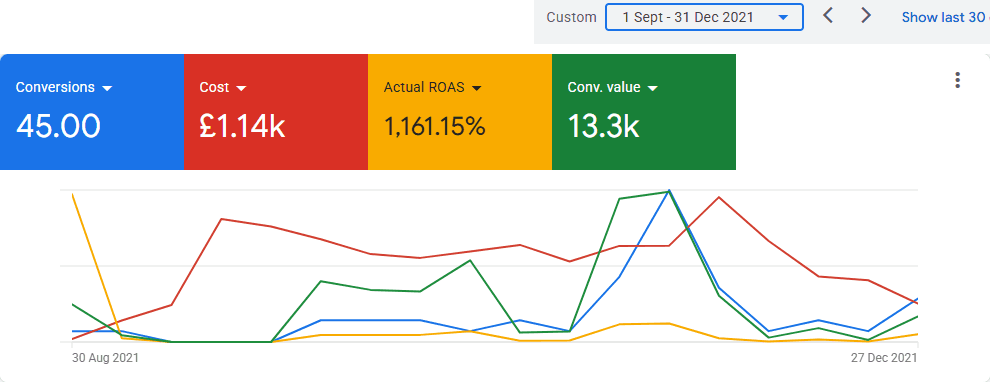
- First 12 months (September 2021 to August 2022): £7.0k spend, 309 orders, £84k revenue, 11.9x.
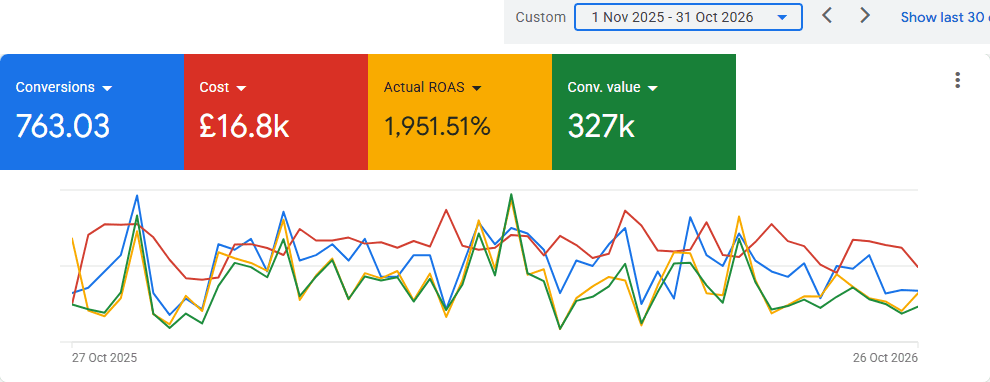
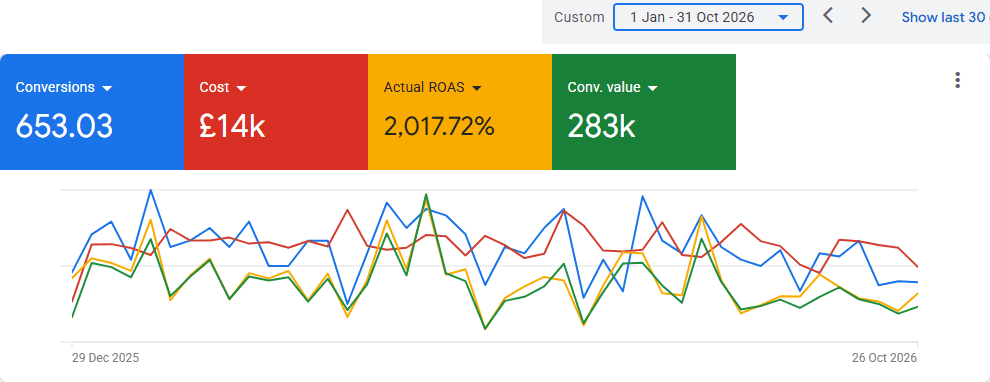
- Last 12 months (November 2025 to October 2026): £16.8k spend, 763 orders, £327k revenue, 19.5x. Spend went up 2.4 times, revenue 3.9 times, and cost per order went from £22.75 to £21.96.
- Best 12 months on record: October 2025 to September 2026, with £338k of revenue from £16.9k of spend (20.1x).
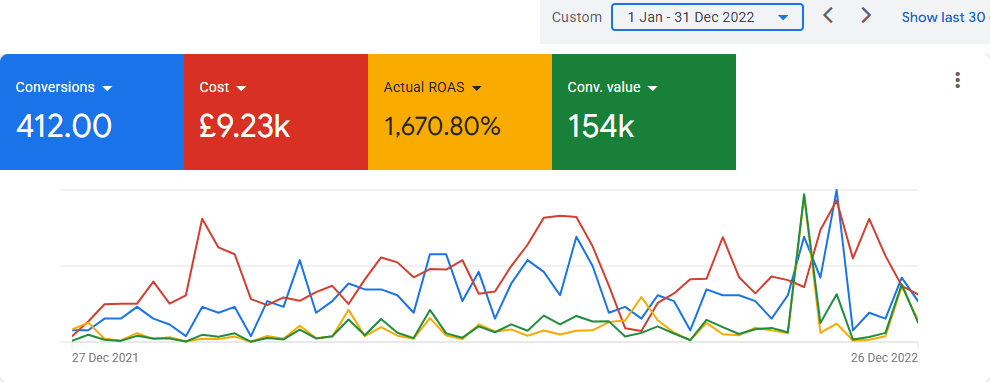
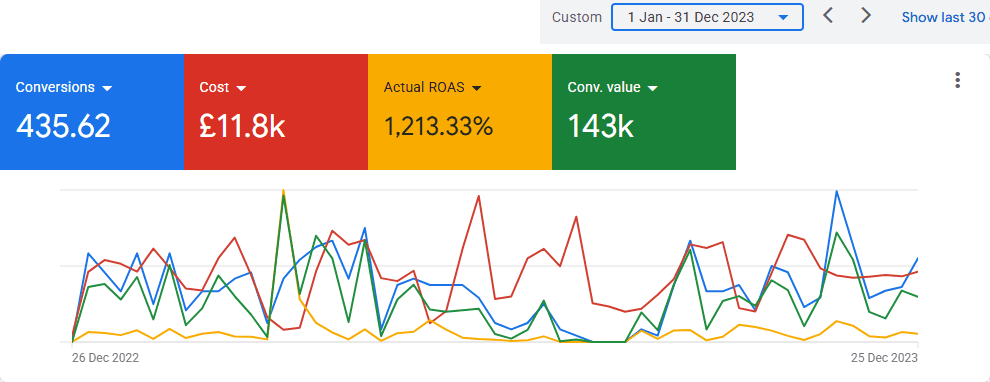
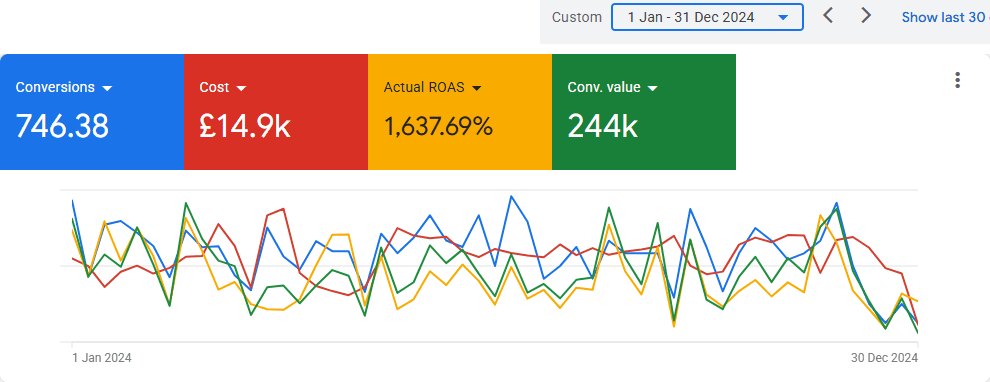
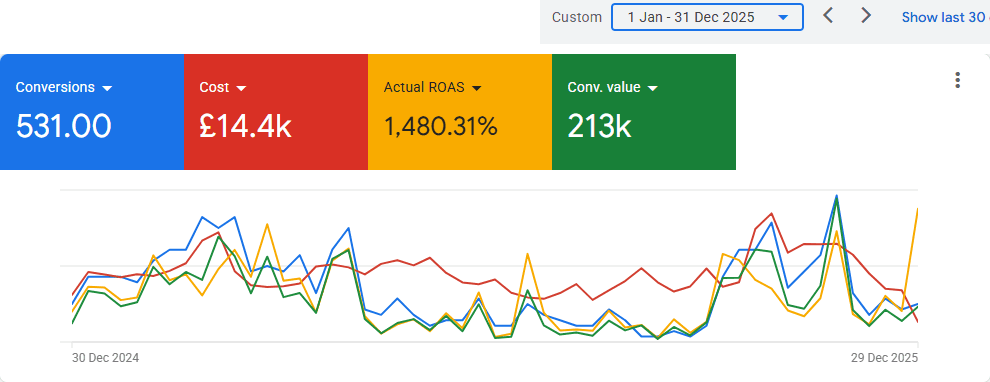
- Return on ad spend was above 11x in every calendar year: 11.6x in 2021 (September to December), 16.7x in 2022, 12.1x in 2023, 16.4x in 2024, 14.8x in 2025 and 20.2x from January to October 2026.
Screenshots from the account
Taken from the client's Google Ads account, cropped so the account name doesn't show and with campaign names blurred.
Want results like these?
Schedule a free consultation and we'll run the same diagnostic on your account.
All figures pulled directly from the client's Google Ads account for September 2021 to October 2026, as recorded and not adjusted. Purchase tracking on the client's website broke twice (July to August 2023 and May to September 2025), so 2023 and 2025 are understated. Google shows ROAS as a percentage in the screenshots (1,604% is 16.0x). Client name anonymised; real data available on request.